
3.3.2. How should the workshop be organised?
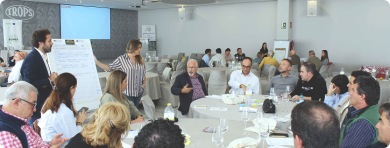
The following stages involve carrying out two collaborative participation exercises, in which all stakeholders are invited and encouraged to share their ideas and perspectives of the territory.
Script for participatory system mapping workshop (3-4 hours)
Download the questions and steps for the organization of the workshop
Download FREE workshop scriptCausal Loops Diagram
.svg)
Narrative: This diagram illustrates a positive feedback loop (reinforcing loop) where the intensive agricultural area leads to agricultural productivity, which raises food production, causing more agricultural profitability and consequently increases the intensive agricultural area.
Causal Loop Diagram Post-production
After completing the Causal Loop Diagram during the stakeholders’ workshop, it is essential to refine the diagram in a process understood as “post-production” (Lopes and Videira, 2015). This refinement aims to enhance the system map while preserving the core structure established by the participants. The post-production process enhances the initial CLDs by ensuring clarity, coherence, and scientific rigor. It transforms the CLD generated diagram developed by stakeholders in the workshop into a refined system map that:
-
Strengthens logical connections, by ensuring all causal relationships are clear and meaningful, the refined CLD becomes a reliable analytical tool.
-
Simplifies Complexity, by aggregating variables, resolving redundancies, and visually distinguishing relationships to make the diagram more accessible for future applications.
-
Bridges knowledge sources, based on insights gathered from literature reviews. This information supports content modifications to the CLD, such as aggregating variables, formalizing causal links and feedback loops, and specifying variable names.
To simplify the diagram, different colors can be used to represent the relationships between the elements. The CLD should be conceptualized as sentences describing the key variables (nouns) and their causal relationships (verbs), expressed in the present tense. After refinement, the CLD serves as a tool for system analysis and should be validated with stakeholders in the "Interventions Assessment Workshop" (see phase 4). The diagram should be revisited as the project progresses and more data becomes available, to ensure its accuracy and relevance. The refined CLD helps identify leverage points, facilitates scenario analysis, and guides strategic planning.
Expected output
After the workshop, a brief report should be prepared outlining the process and outcomes, including the following elements:
-
Venue, date, and agenda;
-
A list of participants, detailing their gender, affiliation, and stakeholder group, based on the categories outlined in the section "Who should be invited to participate in the workshop?";
-
A description of the activities conducted and the results achieved;
-
The vision statement agreed upon by the participants;
-
Finally, include the CLD designed by the stakeholders during the workshop and the post-production version created by the project team, and the narrative derived from the refined or enhanced CLDs.
Note: It would be helpful to include photos from the session and images of the materials developed by the groups to visually illustrate the process.