
5.2.1. How to do a cost-benefit analysis?
The approach to CBA in the WEFeF 2.0 is similar to the method described by Borrego-Marín and Berbel (2019) but consisting of four phases:

definition of the scenario, boundaries of the system, and indicators;

estimation of costs;

estimation of benefits;

estimation of the benefit-to-cost ratio.
Phase 1: Definition of the Scenario, Boundaries of the System, and Indicators
In the first phase of the Cost-Benefit Analysis (CBA), the scenario for evaluating the intervention is defined, alongside the system boundaries. This involves identifying the geographical, temporal, and sectoral scope, and determining the baseline conditions, such as the status of water resources, agricultural practices, and economic factors prior to the intervention.
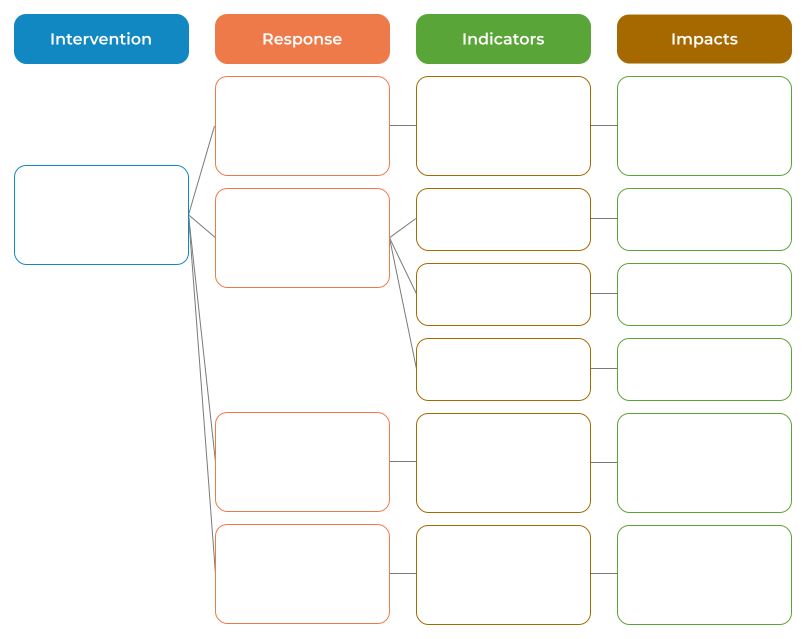
The phase follows four steps:

Intervention Definition
A clear, concise description of the proposed technological solution (e.g. water reclamation plant, solar PV infrastructure).

Identification of Responses
Recognizing how different sectors or stakeholders might respond to the intervention, such as changes in farming practices or energy use.

Identification of Impacts
Assessing broader consequences, including socio-economic effects (job creation, agricultural productivity) and environmental changes (water supply, carbon emissions reduction).

Selection of Indicators
Choosing appropriate economic, environmental, and social indicators to measure both costs and benefits (e.g. expenses, savings, agricultural output, CO2 capture).
Note: This phase ensures that the analysis focuses on factors directly relevant to the intervention, using measurable, objective criteria. Sectoral expertise is needed to determine appropriate boundaries and select meaningful indicators to ensure the analysis is scientifically robust and contextually grounded.
Phase 2: Estimation of Costs
The second phase involves the detailed estimation of all costs associated with the intervention, including capital, operations and maintenance costs, as well as finance costs (debt service). Costs used in the CBA should be marginal, not average costs. However, when there is no detailed cost accounting, average costs are frequently used as an alternative.
Capital costs include, but are not limited to:
-
Infrastructure development (e.g. construction of dams, reservoirs, or irrigation systems in water management projects; building treatment plants for wastewater or pollution control; installing renewable energy systems, such as solar panels or wind turbines).
-
Equipment and machinery (e.g. purchase of agricultural equipment, such as precision farming tools or irrigation machinery; installation of air or water quality monitoring systems; acquisition of vehicles for project implementation or logistics).
-
Land acquisition and preparation (e.g. purchasing land for project facilities or conservation areas; site preparation, including land leveling, clearing, or landscaping).
-
Technology investments (e.g. development or procurement of software for modeling, monitoring, or management; acquisition of advanced technologies for carbon capture or waste recycling).
-
Construction materials and supplies (e.g. materials for building infrastructure, such as cement, steel, pipes, and wiring; supplies needed for specific interventions, like filters for water purification).
- Consulting and professional services (e.g. testing costs, feasibility analyses; design, permitting, and supervision of the system’s design, installation, and connection).
Operation and maintenance costs include:
-
Regular maintenance, cleaning, and periodic inspections.
-
Repairs or parts replacements.
-
Energy costs (e.g. electricity or fuel required for running equipment, machinery, or facilities; energy consumption for processes like water pumping, purification, or heating).
 Definitions cost-benefit analysis
Marginal costs: the additional costs incurred by producing one more unit of a good or service.
Average costs: the total costs of production divided by the number of units produced, representing the cost per unit.
Capital costs: fixed, one-time expenses incurred during the design and construction of the intervention.
Once the costs to be included in the estimation for the intervention have been identified, the next step involves calculating the financial costs using the Annual Equivalent Cost (AEC) method. This approach distributes the capital costs of construction, equipment, and other initial investments, along with the ongoing operating and maintenance expenses, into equal annual amounts over the project’s lifetime, thus providing a clear estimate of the annual financial commitment required for the intervention.
The AEC is calculated using the formula which has been applied for water economics by Berbel et al (2011):

Where:
-K represents the investment costs;
-OMC are the operational and maintenance costs;
-r is the discount rate;
-n is the useful life of the intervention.
In this phase, external costs, such as environmental impacts or opportunity costs associated with land use, should be incorporated to capture the total economic burden of the intervention. This will enable a balanced comparison with the projected benefits in subsequent stages. For example, the costs of CO2 emissions and other greenhouse gases should be considered, reflecting their impact on climate change and associated societal costs, such as public health impacts and damage to infrastructure. The estimation of these costs can be done through tools like the Social Cost of Carbon Explorer or secondary sources such as existing studies and databases.
The data for cost estimation can be obtained from primary sources, such as field surveys, or secondary sources like national statistics, technical reports, and case studies. Expert consultations, stakeholder inputs, and market surveys can also provide valuable insights to refine cost estimates.
.svg) Depending on the intervention, the required data may include various types of information
Depending on the intervention, the required data may include various types of information
-
Extension of land cultivated with each crop in the irrigated area (crop mix)
-
% of land with tree crops in the irrigated area
-
Volume of water required for crop irrigation (per ha) (irrigation dose per crop)
-
Annual income per crop cultivated (per ha)
-
Average annual salary in agriculture
-
Average annual salary in other sectors
-
Gross value added per worker in agriculture
-
Gross value added per worker in other sectors
-
Economic multiplier of the agricultural sector
-
Concentration of nitrogen in treated wastewater
-
Average purchasing price of energy
-
Average selling price of energy
-
Average price of diesel
-
Average price of CO2
-
Average price of nitrogen
-
Cost of nitrogen pollution
-
Rate of CO2 capture by tree crops per unit area and/or time
-
Average CO2 emitted for energy generation
Phase 3: Estimation of Benefits (Direct and Indirect Benefits)
In this phase, both direct and indirect benefits of the project are quantified to understand its positive outcomes.
.png)

Data for benefits can be collected through primary sources (e.g. field surveys) or secondary sources (e.g. studies, reports). The challenge lies in valuing indirect or non-market benefits, such as improved air quality or enhanced biodiversity, which require specialized methods like contingent valuation or input-output models. Secondary data from government sources, research, or industry reports can help estimate these benefits, allowing for a more comprehensive and cost-effective approach to quantification.
Converting all benefits into a common monetary metric enables comparison with costs, aiding in a clearer understanding of the project's overall economic impact.
Phase 4: Estimation of Benefit-Cost Ratio (BCR)
In the final phase of the Cost-Benefit Analysis (CBA), the benefit-cost ratio (BCR) is calculated to assess the economic viability of the intervention. The BCR is determined by dividing the total monetized benefits by the total costs. A BCR greater than 1 indicates economic benefit, while a ratio below 1 means the costs exceed the benefits. This ratio simplifies decision-making by providing a clear assessment of the intervention's value.
The interpretation of the BCR depends on factors such as: discount rate applied, time horizon, context & assumptions.
It is important to consider other qualitative factors alongside the BCR for a more comprehensive evaluation. CBA is context-specific, and the methodology should be adapted to the project’s objectives, sector, and context. Users are encouraged to consult the European Commission’s Guide to Cost-benefit Analysis for detailed guidance.
The CBA method also involves trade-offs, including balancing economic and non-economic factors, short-term versus long-term impacts, local versus global effects, and sustainability versus economic growth. Selecting a discount rate and addressing uncertainties in future estimates also introduce trade-offs that must be carefully considered.