5.1.1. How to do the REWEFe analysis

The REWEFe tool can be used by accessing the following link: https://www.futurewater.eu/tools/rewefe/
Effective data collection relies on two key elements:

Main data sources
The Input sheet of the REWEFe tool requires users to insert data related to land use, water demands and flows, energy demands and production as well as the monetary values of the ecosystem components. The data can either be obtained through primary sources such as field surveys and ground measurements or can be collected from secondary sources such as national official statistics, technical reports, literature studies and remote sensing.
Note: Users are encouraged to explore platforms such as EarthMap, Google Earth Engine, AQUASTAT and WaPOR to extract certain data inputs (e.g. precipitation, land use, evapotranspiration, population, etc.) for their own focal area. More technical guidance can be found in the manual.
.png)
Scenario definition
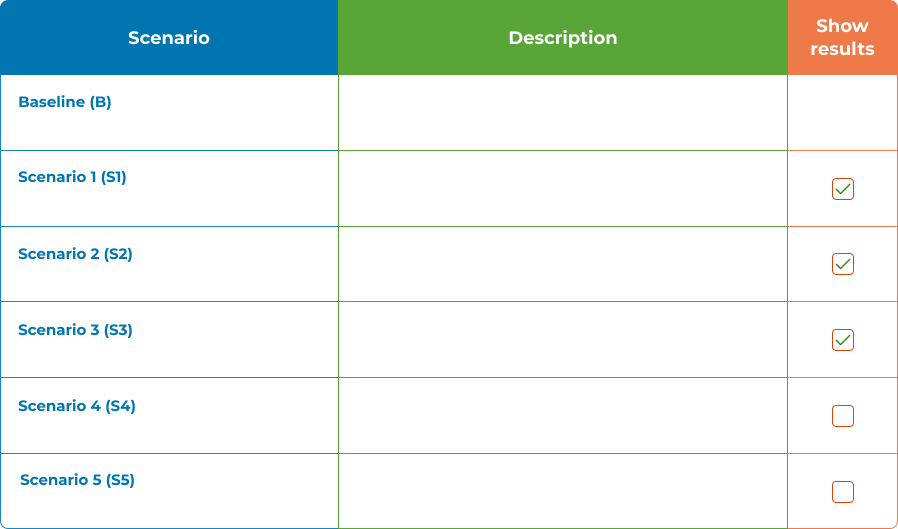
The user can define several scenarios. The first scenario is always the baseline scenario, meaning the no-intervention scenario. Scenarios 1–5 are the intervention scenarios. The number of scenarios can be selected through the tick box (Figure 5.1). The user is free to decide whether each scenario (S1 – S5) refers to:
-
Each a different intervention: to compare different interventions in one single display of the result tab, or
-
Different levels of implementation of the same intervention: to compare how increasing the implementation level of an intervention impacts the various indicators in the result tab.
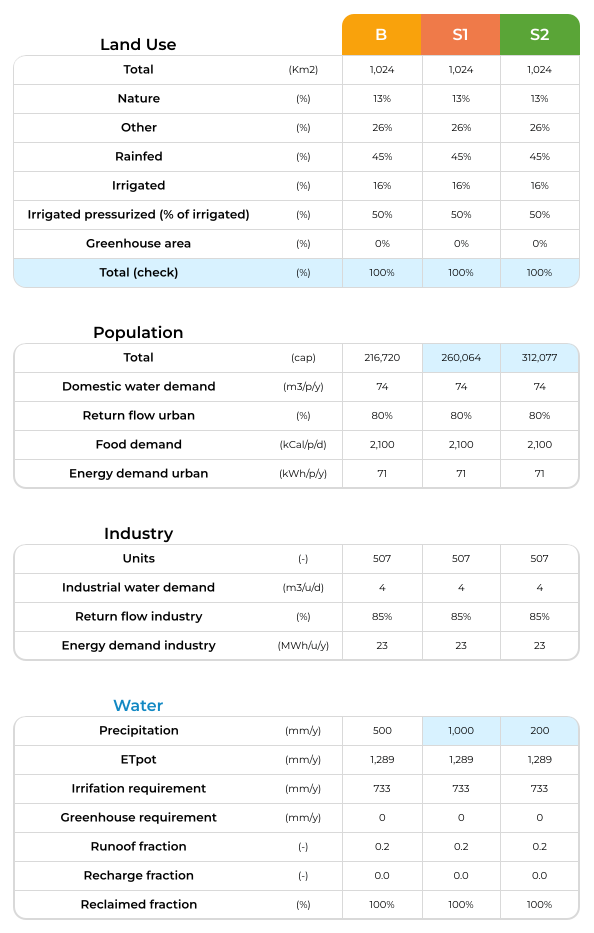
REWEFe allows users to easily check if an input parameter value of a scenario varies from the baseline parameter value, because only if it is different, the cell is highlighted in blue (as shown in Figure 5.2). This allows users to easily identify the differences between the scenarios and the baseline.
.svg) Optional pathways
Optional pathways
Data Analysis
The REWEFe tool presents results in two tabs: Results and Sector Details.
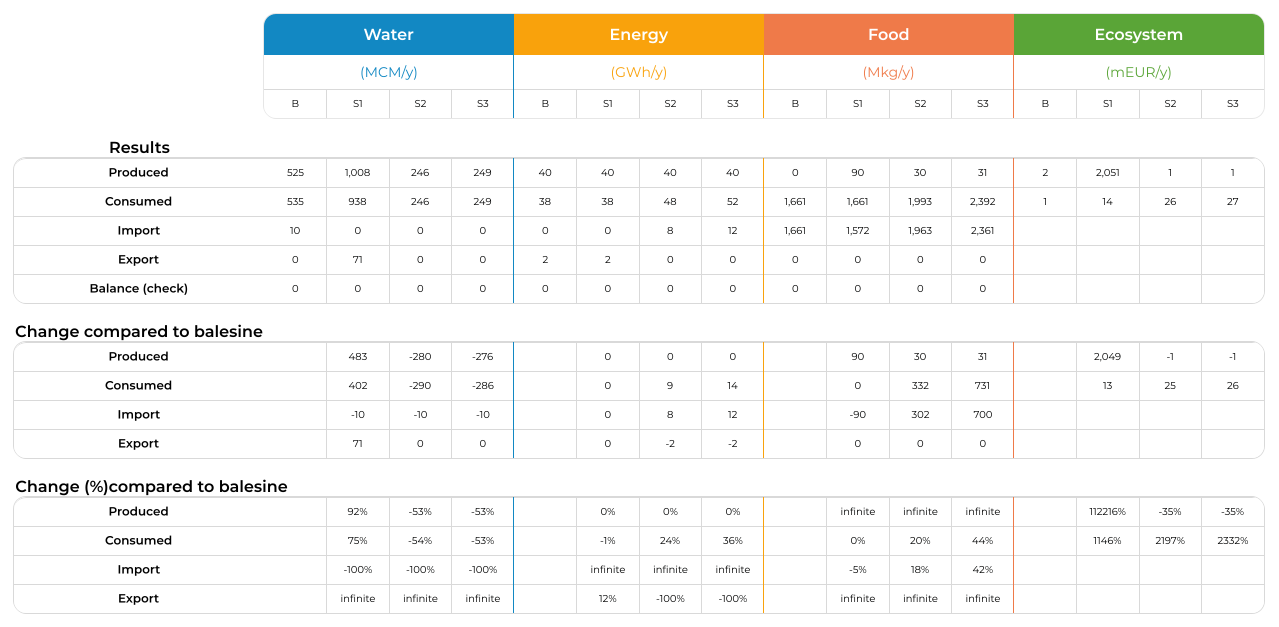
- The Results tab provides a quick overview with bar graphs showing absolute and relative changes (compared to the baseline) in production, consumption, import, and export across the four sectors. It allows users to compare scenarios (S1-S3) with the baseline (B) to assess the impact of interventions.
- The tab also indicates resource balances: if production and consumption are imbalanced, it must be balanced by imports or exports. For the ecosystem sector, the tool shows "produced" versus "consumed" impacts, expressed in monetary terms.
The second result tab (Sector Details) provides the users with a detailed breakdown of each sector, providing values for all the subcomponents considered.
- This allows users to view the absolute values as well as the percentage changes (negative or positive).
- The table also includes additional indicators such as blue water stress, nutrient stress, and groundwater storage change, among others, enabling users to further assess the sector through multiple lenses.
Note: For interpreting these detailed results, the user is referred to the REWEFe manual.
.svg)